
Premier League Bet Builder Opportunities for Fixtures in the Next 4 Days
A fixture-by-fixture analysis of upcoming matches using Football Pro Predictions Season Stats and Last 25 Games data, focusing on independently derived research opportunities across goals, corners, cards and team-volume markets.
Data is sourced from Football Pro Predictions Season Stats and Last 25 Games. These are research indicators only—check current team news, market availability and bookmaker rules, and always do your own research.
Ipswich Town vs Liverpool
Goals are the clearest starting point. Ipswich’s home last-25 matches average 2.67 total goals, while Liverpool’s away sample averages 3.38, producing a blended indication just above three. Both splits cleared 1.5 goals at least 84.62% of the time, whereas the 2.5-goal rates were 58.33% and 53.85%. Over 1.5 goals is therefore the more cautious research line. The season readings are all based on one relevant match and support goal activity, but should not dictate the choice.
Ipswich’s home scoring average is 2.00 and Liverpool concede 1.77 goals per away game, a blended attacking expectation of 1.89 for the hosts. Ipswich scored in every home game in the last-25 split, while Liverpool conceded in 69.23% away. Ipswich over 0.5 team goals is a reasonable line to investigate, although Liverpool’s broader defensive profile means it is less secure than the match-goals leg.
Corners offer a deeper sample. Ipswich home matches average 10.00 corners and Liverpool away matches 10.08, pointing to roughly 10.04. Each split cleared seven corners in at least 76.92% of games. Over 7.5 match corners leaves room below the average; the single-match season figures also recorded eight and 12 corners respectively, but are only a cross-check.
For an Ipswich corner angle, the home side take 6.50 per game and Liverpool allow 4.92 away, giving a blended figure of 5.71. Ipswich exceeded four corners in 75.00% of home matches, while Liverpool allowed five or more in 23.08%; that conflict argues for Ipswich over 3.5 corners rather than a more demanding line. Ipswich’s three season corners underline the caution.
The cards case is stronger in the second half. Ipswich home games average 3.25 second-half cards and Liverpool away games 3.08, for a blended 3.17. Those splits cleared one second-half card in 83.33% and 92.31% of matches. Over 1.5 second-half cards is conservative; each side’s season sample also produced two in that period.
Shot volume supports a total rather than a side. Ipswich home fixtures produce 25.58 shots and Liverpool away fixtures 26.54, an expectation around 26.06. Over 23.5 match shots is the restrained line to investigate. The season figures were 21 and 42, illustrating volatility but not contradicting a lower threshold.
Finally, fouls average 25.58 in Ipswich home matches and 24.46 in Liverpool away games, giving a 25.02 blend. Over 22.5 match fouls has room beneath both historical averages and is preferable to a team-fouls market, where the paired evidence is less aligned. The current-season readings of 26 and 19 show why a moderate line is appropriate.
Recommendations
Key takeaways
- Over 1.5 match goals
- Ipswich Town over 0.5 goals
- Over 7.5 match corners
- Ipswich Town over 3.5 corners
- Over 1.5 second-half cards
- Over 23.5 match shots
- Over 22.5 match fouls
Conservative example builder: over 1.5 match goals, over 7.5 corners and over 1.5 second-half cards. Each leg follows the more stable match-level distributions. Higher-variance example builder: Ipswich over 0.5 goals, Ipswich over 3.5 corners and over 23.5 match shots; this leans into Ipswich’s strong home-for indicators.
Newcastle United vs AFC Bournemouth
This is a goals-led fixture. Newcastle home games average 3.92 goals and Bournemouth away games 3.54, creating a 3.73 blended expectation. The respective over-2.5 rates are 91.67% and 61.54%, so over 2.5 goals is supported by both venue splits. Season readings were mixed across only one match each, making the longer sample the decisive evidence.
Both teams to score has paired support: Newcastle scored in all 12 home matches and conceded in all of them, while Bournemouth scored in 84.62% and conceded in 84.62% away. Newcastle’s home BTTS-and-over-2.5 rate is 91.67%; Bournemouth’s away equivalent is 53.85%. BTTS is an investigatory line, but its lower Bournemouth frequency makes it a higher-risk addition than total goals.
The match-corner averages are 10.33 for Newcastle at home and 10.69 for Bournemouth away, a blend of 10.51. Both cleared 7.5 corners in at least 83.33% of matches. Over 7.5 match corners is the measured route, with season totals of eight and 16 serving only as a volatile cross-check.
Newcastle’s team-corner numbers are well matched. They take 5.75 home corners, while Bournemouth concede 7.31 away, pointing to 6.53. Newcastle exceeded four corners in 58.33% of home games and Bournemouth allowed at least five in 61.54% away. Newcastle over 3.5 corners is the conservative research opportunity.
Cards are more convincing after half-time. Newcastle home matches average 4.00 second-half cards and Bournemouth away matches 2.54, for 3.27 combined. Over 1.5 second-half cards landed in 91.67% and 76.92% of the relevant samples. The season displays also recorded multiple late cards, although neither one-game result should be weighted heavily.
Shot data suggests over 24.5 match shots. Newcastle home fixtures average 29.17 shots and Bournemouth away fixtures 27.38, yielding 28.28. That sits comfortably above the line, while the season figures of 40 and 28 show the category can be active. This is a total-volume selection, not a claim that either team will reach a particular individual total.
A final alternative is over 21.5 match fouls. Newcastle’s home average is 24.92 and Bournemouth’s away average 23.08, resulting in 24.00. Both sides’ current-season figures also exceeded that level, though the historical averages provide the firmer base. Whole-number lines should be checked for push treatment before selection.
Recommendations
Key takeaways
- Over 2.5 match goals
- Both teams to score
- Over 7.5 match corners
- Newcastle United over 3.5 corners
- Over 1.5 second-half cards
- Over 24.5 match shots
- Over 21.5 match fouls
Conservative example builder: over 2.5 goals, over 7.5 corners and over 1.5 second-half cards. Higher-variance example builder: both teams to score, Newcastle over 3.5 corners and over 24.5 match shots, combining the fixture’s open-game indicators.
Nottingham Forest vs Tottenham Hotspur
The contrasting goal profiles counsel restraint. Forest home matches average 1.62 goals, while Tottenham away matches average 3.67, producing a 2.65 blend. The 1.5-goal rates are 46.15% and 100.00%, so over 1.5 goals is supportable but over 2.5 depends heavily on Tottenham’s away record. The tiny season sample also points in opposite directions.
Tottenham over 0.5 goals has the better team-goals case. Spurs scored in 91.67% of away matches, while Forest conceded in 69.23% at home. Their attack averages 2.08 away goals against Forest’s 0.85 home goals conceded, a 1.47 blend. The cautious line avoids assuming Tottenham score twice.
Corners are a stronger shared category. Forest home matches average 8.15 corners and Tottenham away games 10.92, a 9.54 expectation. Both samples cleared 6.5 corners at least 76.92% of the time. Over 6.5 match corners is therefore more proportionate than following the season’s polarised one-match readings.
Forest’s home corner production is 5.38, and Tottenham allow 5.75 away, a blend of 5.57. Forest exceeded four corners in 69.23% of home games and Spurs conceded five or more in 41.67% away. Forest over 3.5 corners is a cautious team line; Forest’s three season corners are a reminder not to push higher.
For shots, Forest average 15.92 at home and Tottenham allow 16.00 away, creating a particularly aligned 15.96 projection. Forest had at least 15 shots in 84.62% of their home last-25 sample. Forest over 11.5 shots allows for normal variation; the season figure of 12 supports the modest threshold.
The match shots-on-target averages are 7.92 and 10.25, blending to 9.09. Over 6.5 shots on target is below both venue averages. Forest’s home and Tottenham’s away season samples registered five and seven, respectively, which is consistent with a restrained total rather than a high side-specific line.
Cards can be approached through a low threshold. Forest home matches average 2.77 cards and Tottenham away matches 3.92, giving 3.35. Both relevant splits recorded over 1.5 cards in more than three quarters of games. Over 1.5 match cards is the sensible research line; no derby assumption is required.
Recommendations
Key takeaways
- Over 1.5 match goals
- Tottenham Hotspur over 0.5 goals
- Over 6.5 match corners
- Nottingham Forest over 3.5 corners
- Nottingham Forest over 11.5 shots
- Over 6.5 match shots on target
- Over 1.5 match cards
Conservative example builder: Tottenham over 0.5 goals, over 6.5 corners and over 1.5 cards. Higher-variance example builder: over 1.5 goals, Forest over 3.5 corners and Forest over 11.5 shots, which relies on Forest’s home-volume profile.
Manchester City vs Coventry City
Manchester City’s home goal average is 3.08, while Coventry’s away total is 2.77, a blended match expectation of 2.93. Both splits cleared 1.5 goals at least 76.92% of the time, and City cleared 2.5 in 91.67%. Over 1.5 match goals is the conservative line; the season’s high totals are too limited to justify a more ambitious threshold alone.

City over 0.5 goals is supported by a 2.25 home scoring average and Coventry conceding 1.08 away, a 1.67 blend. City scored in every relevant last-25 home match; Coventry conceded in 61.54% away. City over 1.5 goals also has evidence, but the lower line better reflects Coventry’s relatively modest away goals-against number.
City’s team corners are a major volume area: 7.42 at home, against Coventry’s 4.38 conceded away, equalling a 5.90 blended expectation. City exceeded four corners in 83.33% of home games, while Coventry allowed five or more in 30.77%. City over 4.5 corners is a defensible compromise, cross-checked by City’s eight in the season home match.
The combined corner averages are 11.17 and 10.85, suggesting 11.01. Both venue samples cleared 6.5 corners in at least 84.62% of games. Over 7.5 match corners provides ample margin and does not require City to account for nearly all of the total.
City average 17.58 home shots, while Coventry concede 14.31 away, producing 15.95. City had the most shots in 83.33% of their home sample. City over 12.5 shots is lower than the paired expectation and consistent with the season reading of 13, but it remains dependent on team-news and match-state factors.
For shots on target, City produce 6.00 at home and Coventry allow 4.31 away, a 5.16 blend. City led the shots-on-target count in 83.33% of their relevant sample. City over 3.5 shots on target is the cautious option; the current-season home figure was six, but should only corroborate the longer record.
Cards provide a separate, low-bar option. City home fixtures average 3.58 cards and Coventry away matches 3.62, for 3.60. Both cleared two cards in at least 66.67% of games. Over 1.5 match cards is safer than projecting a high disciplinary total, despite the three-card season readings.
Recommendations
Key takeaways
- Over 1.5 match goals
- Manchester City over 0.5 goals
- Manchester City over 4.5 corners
- Over 7.5 match corners
- Manchester City over 12.5 shots
- Manchester City over 3.5 shots on target
- Over 1.5 match cards
Conservative example builder: City over 0.5 goals, City over 4.5 corners and over 1.5 cards. Higher-variance example builder: City over 12.5 shots, City over 3.5 shots on target and over 7.5 match corners, all tied to City’s home-volume data.
Fulham vs Crystal Palace
Fulham home matches average 2.71 goals, while Crystal Palace away matches average 2.18, giving a 2.45 blend. The over-1.5 rates are 71.43% and 63.64%; over 1.5 match goals is consequently better supported than over 2.5. Fulham’s five-goal season match is an outlier-sized sample and should not inflate the threshold.
Fulham over 0.5 goals is supported by 1.64 home goals scored and Palace conceding 1.45 away, an expectation of 1.55. Fulham scored in 78.57% of home matches and Palace conceded in 81.82% away. The season record also has Fulham scoring, although Palace’s single away blank reinforces the preference for a conservative line.
The corner evidence favours the home side. Fulham average 6.21 home corners and Palace concede 5.83 away, a 6.02 blend. Fulham exceeded four in 71.43% of home games, while Palace allowed five or more in 58.33% away. Fulham over 4.5 corners is a reasonable investigation line; their season six corners support it without being decisive.
Total corners average 11.71 in Fulham home fixtures and 9.91 in Palace away games, pointing to 10.81. Both samples cleared 6.5 corners at least 92.86% of the time. Over 7.5 match corners is deliberately set below the blend; the current-season total figures are less persuasive because they differ sharply.
Fulham’s home shot average is 16.86 and Palace allow 13.00 away, giving 14.93. Fulham had the most shots in 71.43% of their home matches. Fulham over 11.5 shots is therefore more robust than a high goal line, and the season total of 14 provides a modest confirmation.
Second-half cards are more attractive than first-half cards. Fulham home games average 3.71 second-half cards and Palace away matches 1.45, a 2.58 expectation. The over-1.5 rate is 100.00% for Fulham’s home sample and 45.45% for Palace’s away sample. Over 0.5 second-half cards is the lower-risk research option.
Over 18.5 match fouls is another independently supported low line. Fulham home matches average 20.29 fouls, Palace away games 19.00, and the blend is 19.65. Season figures of 19 and 25 also clear it, but settlement rules for foul markets should be checked before inclusion.
Recommendations
Key takeaways
- Over 1.5 match goals
- Fulham over 0.5 goals
- Fulham over 4.5 corners
- Over 7.5 match corners
- Fulham over 11.5 shots
- Over 0.5 second-half cards
- Over 18.5 match fouls
Conservative example builder: Fulham over 0.5 goals, over 7.5 corners and over 0.5 second-half cards. Higher-variance example builder: Fulham over 4.5 corners, Fulham over 11.5 shots and over 1.5 match goals, centred on the home side’s attacking volume.
Brighton & Hove Albion vs Leeds United
Brighton home matches average 2.58 goals and Leeds away games 2.54, leaving a close 2.56 blended expectation. The over-1.5 rates are 83.33% and 69.23%, so over 1.5 match goals is a stronger research opportunity than the 2.5 line, which landed in 58.33% and 46.15%. The high season scores are based on one match each.
Brighton over 0.5 goals is well paired: they score 1.83 per home match, while Leeds concede 1.38 away, a 1.61 blend. Brighton scored in 75.00% of home fixtures and Leeds conceded in 78.57% away. The season display also shows Brighton scoring, but the long-window rates justify the selection.
Brighton’s shot profile is notable. They average 14.58 home shots, and Leeds allow 14.36 away, producing 14.47. Brighton recorded the most shots in 91.67% of their home sample. Brighton over 10.5 shots is a cautious team-volume line, with the season home total of 21 offering only a secondary check.
Brighton also average 5.08 home shots on target, while Leeds concede 4.21 away, for 4.65. Brighton led the shots-on-target count in 75.00% of the home split. Brighton over 3.5 shots on target has a buffer below the blend; it is preferable to relying on the six recorded in the single season match.
Corner evidence supports a match total. Brighton home matches average 8.50 corners and Leeds away matches 11.23, a 9.87 indication. Both sides exceeded 6.5 in at least 91.67% of the relevant samples. Over 6.5 match corners is conservative, while the sharply different season figures make a higher line less attractive.
Leeds’ away matches allow 7.14 corners, while Brighton take 5.00 at home, giving a 6.07 blended Brighton projection. Brighton over 3.5 corners is the lower team line to investigate. Brighton’s 50.00% home rate above four corners prevents a recommendation at 4.5 despite Leeds’ generous concession figure.
Cards should be kept moderate. Brighton home fixtures average 3.92 cards and Leeds away games 3.77, blending to 3.85. Both cleared 1.5 cards in more than 83% of matches. Over 1.5 match cards is supported by both windows; no conclusion should be drawn from Brighton’s one-match season red-card reading.
Recommendations
Key takeaways
- Over 1.5 match goals
- Brighton & Hove Albion over 0.5 goals
- Brighton & Hove Albion over 10.5 shots
- Brighton & Hove Albion over 3.5 shots on target
- Over 6.5 match corners
- Brighton & Hove Albion over 3.5 corners
- Over 1.5 match cards
Conservative example builder: Brighton over 0.5 goals, over 6.5 corners and over 1.5 cards. Higher-variance example builder: Brighton over 10.5 shots, Brighton over 3.5 shots on target and Brighton over 3.5 corners.
Brentford vs Sunderland
The match-goals averages are 2.70 for Brentford at home and 3.00 for Sunderland away, giving 2.85. Each relevant split cleared 1.5 goals at least 73.33% of the time, while over 2.5 landed in 60.00% and 46.67%. Over 1.5 match goals is the cautious research line, irrespective of the two one-game season results.
Brentford over 0.5 goals has reasonable paired evidence. Their home scoring average is 1.60 and Sunderland concede 1.27 away, producing 1.44. Brentford scored in 70.00% of their home games and Sunderland conceded in 85.71% away. The season home score of three supports the direction but is not a threshold-setting sample.
Corners are the standout market. Brentford home fixtures average 9.60 and Sunderland away fixtures 11.47, a 10.54 blend. Both cleared 7.5 corners in at least 80.00% of games. Over 7.5 match corners sits well below that blended expectation, while season totals of 10 and 11 are consistent cross-checks.
Brentford take 5.50 home corners and Sunderland concede 4.93 away, pointing to 5.22. Brentford exceeded four corners in 70.00% of home games, while Sunderland allowed five or more in 35.71% away. Brentford over 3.5 corners is the more measured team selection.
The second half provides a distinct corner angle. Brentford home games average 4.40 second-half corners, Sunderland away matches 6.40, yielding 5.40. Both cleared 2.5 in at least 90.00% of games. Over 2.5 second-half corners has stronger distributional backing than the dramatic season split alone.
Cards average 3.10 in Brentford home fixtures and 3.60 in Sunderland away games, a 3.35 blend. Over 1.5 cards landed in 80.00% and 93.33% of those samples. Over 1.5 match cards is the appropriate low line; Sunderland’s season four cards should not be treated as a forecast.
Shot totals average 25.90 and 26.87, making 26.39 across the two venue profiles. Over 22.5 match shots is a restrained volume option. The current-season totals of 35 and 34 are far higher, but the historical blend provides the more credible anchor.
Recommendations
Key takeaways
- Over 1.5 match goals
- Brentford over 0.5 goals
- Over 7.5 match corners
- Brentford over 3.5 corners
- Over 2.5 second-half corners
- Over 1.5 match cards
- Over 22.5 match shots
Conservative example builder: over 1.5 goals, over 7.5 corners and over 1.5 cards. Higher-variance example builder: Brentford over 0.5 goals, Brentford over 3.5 corners and over 2.5 second-half corners, connecting Brentford’s home attack with the late-corner profiles.
Hull City vs Aston Villa
This fixture requires more restraint than the season figures imply. Hull home matches average 2.69 goals and Aston Villa away games 2.17, a 2.43 blend. Their over-1.5 rates are 69.23% and 66.67%. Over 1.5 match goals is supported, but the one-game season records should not be used to endorse a high-goals position.
Hull over 0.5 goals is the cleaner team-goal route. Hull score 1.31 per home game and Villa concede 1.08 away, producing 1.20. Hull scored in 69.23% of home games, while Villa conceded in 84.62% away. Hull’s two season goals corroborate the low threshold, not a higher one.
Corners show a genuine venue contrast. Hull home matches average 7.92 corners and Villa away matches 12.00, yielding 9.96. Both cleared 6.5 corners in more than 69% of the relevant samples. Over 6.5 match corners has a sensible buffer beneath the blend.
The first-half corner data are also usable. Hull average 3.31 first-half corners at home and Villa 6.00 away, a 4.66 blend. The over-2.5 rates are 61.54% and 91.67%. Over 2.5 first-half corners is worth investigating, but the lower Hull hit rate argues against extending the line further.
Cards have paired depth. Hull home games average 3.85 cards and Villa away matches 4.50, an expectation of 4.18. Both samples cleared 2.5 cards at least 69.23% of the time. Over 2.5 match cards is supported by the longer data; the season card totals are merely consistent with that direction.
Second-half cards provide a more cautious alternative. Hull home fixtures average 2.92 and Villa away games 3.42, creating 3.17. Both cleared one second-half card in at least 69.23% of matches. Over 1.5 second-half cards is a lower threshold with evidence on each side.
Hull’s home throw-ins average 44.38, whereas Villa away games average 28.85; the contrast is too wide to create a confident simple blend. No recommended line — paired evidence unavailable for a responsible throw-in threshold. A better-supported seventh area is over 19.5 match fouls: Hull average 20.23 at home and Villa 20.67 away, a 20.45 blend.
Recommendations
Key takeaways
- Over 1.5 match goals
- Hull City over 0.5 goals
- Over 6.5 match corners
- Over 2.5 first-half corners
- Over 2.5 match cards
- Over 1.5 second-half cards
- Over 19.5 match fouls
Conservative example builder: over 1.5 goals, over 6.5 corners and over 1.5 second-half cards. Higher-variance example builder: Hull over 0.5 goals, over 2.5 first-half corners and over 2.5 match cards, combining three separately supported areas.
Everton vs Manchester United
Everton home matches average 3.00 goals and Manchester United away games 2.54, giving a 2.77 projection. The over-1.5 rates are 91.67% and 76.92%, so over 1.5 match goals has clear venue-specific backing. The season samples each produced two goals, but do not alter the more meaningful longer-window conclusion.
Everton over 0.5 goals is supported by their 1.50 home scoring average and United conceding 1.08 away, a 1.29 blend. Everton scored in 91.67% of home matches, while United conceded in 66.67% away. The selection is more defensible than Everton to score twice, which lacks the same frequency support.
Second-half goals are a distinct opportunity. Everton home games average 2.08 second-half goals and United away matches 1.62, for 1.85. Over 0.5 second-half goals landed in 100.00% and 84.62% of the samples. Over 0.5 second-half goals is therefore the cautious timing angle, with current-season data also showing late scoring.
Match corners average 8.67 for Everton home fixtures and 10.54 for United away fixtures, resulting in 9.61. Both splits cleared 6.5 corners in 83.33% or more of games. Over 6.5 match corners is appropriately below the expectation, unlike the extreme 17-corner United season sample.
United’s corner-for average is 4.62 away, while Everton concede 4.58 at home, a 4.60 blend. United exceeded four corners in 41.67% of away games and Everton allowed five or more in 41.67%. Manchester United over 2.5 corners is the conservative team line; a 3.5 line would have less margin.
Cards average 3.42 in Everton home matches and 3.15 in United away games, a 3.29 blend. Both cleared 1.5 match cards in at least 76.92% of the relevant sample. Over 1.5 cards is the disciplined choice, rather than interpreting either side’s one-match card count as predictive.
Shots on target average 9.00 in Everton home games and 8.77 in United away matches, giving 8.89. Over 6.5 match shots on target is below both venue averages. The season figures are higher at nine and 12, but the proposed line is grounded in the longer sample rather than those isolated totals.
Recommendations
Key takeaways
- Over 1.5 match goals
- Everton over 0.5 goals
- Over 0.5 second-half goals
- Over 6.5 match corners
- Manchester United over 2.5 corners
- Over 1.5 match cards
- Over 6.5 match shots on target
Conservative example builder: over 1.5 goals, over 0.5 second-half goals and over 1.5 cards. Higher-variance example builder: Everton over 0.5 goals, United over 2.5 corners and over 6.5 shots on target.
Arsenal vs Chelsea
Arsenal home games average 2.23 goals, while Chelsea away games average 2.25, a balanced 2.24 blend. Both splits cleared 1.5 goals in at least 66.67% of matches, whereas the over-2.5 rates are 46.15% and 41.67%. Over 1.5 match goals is the more responsible research line; the season totals are too small to redefine it.
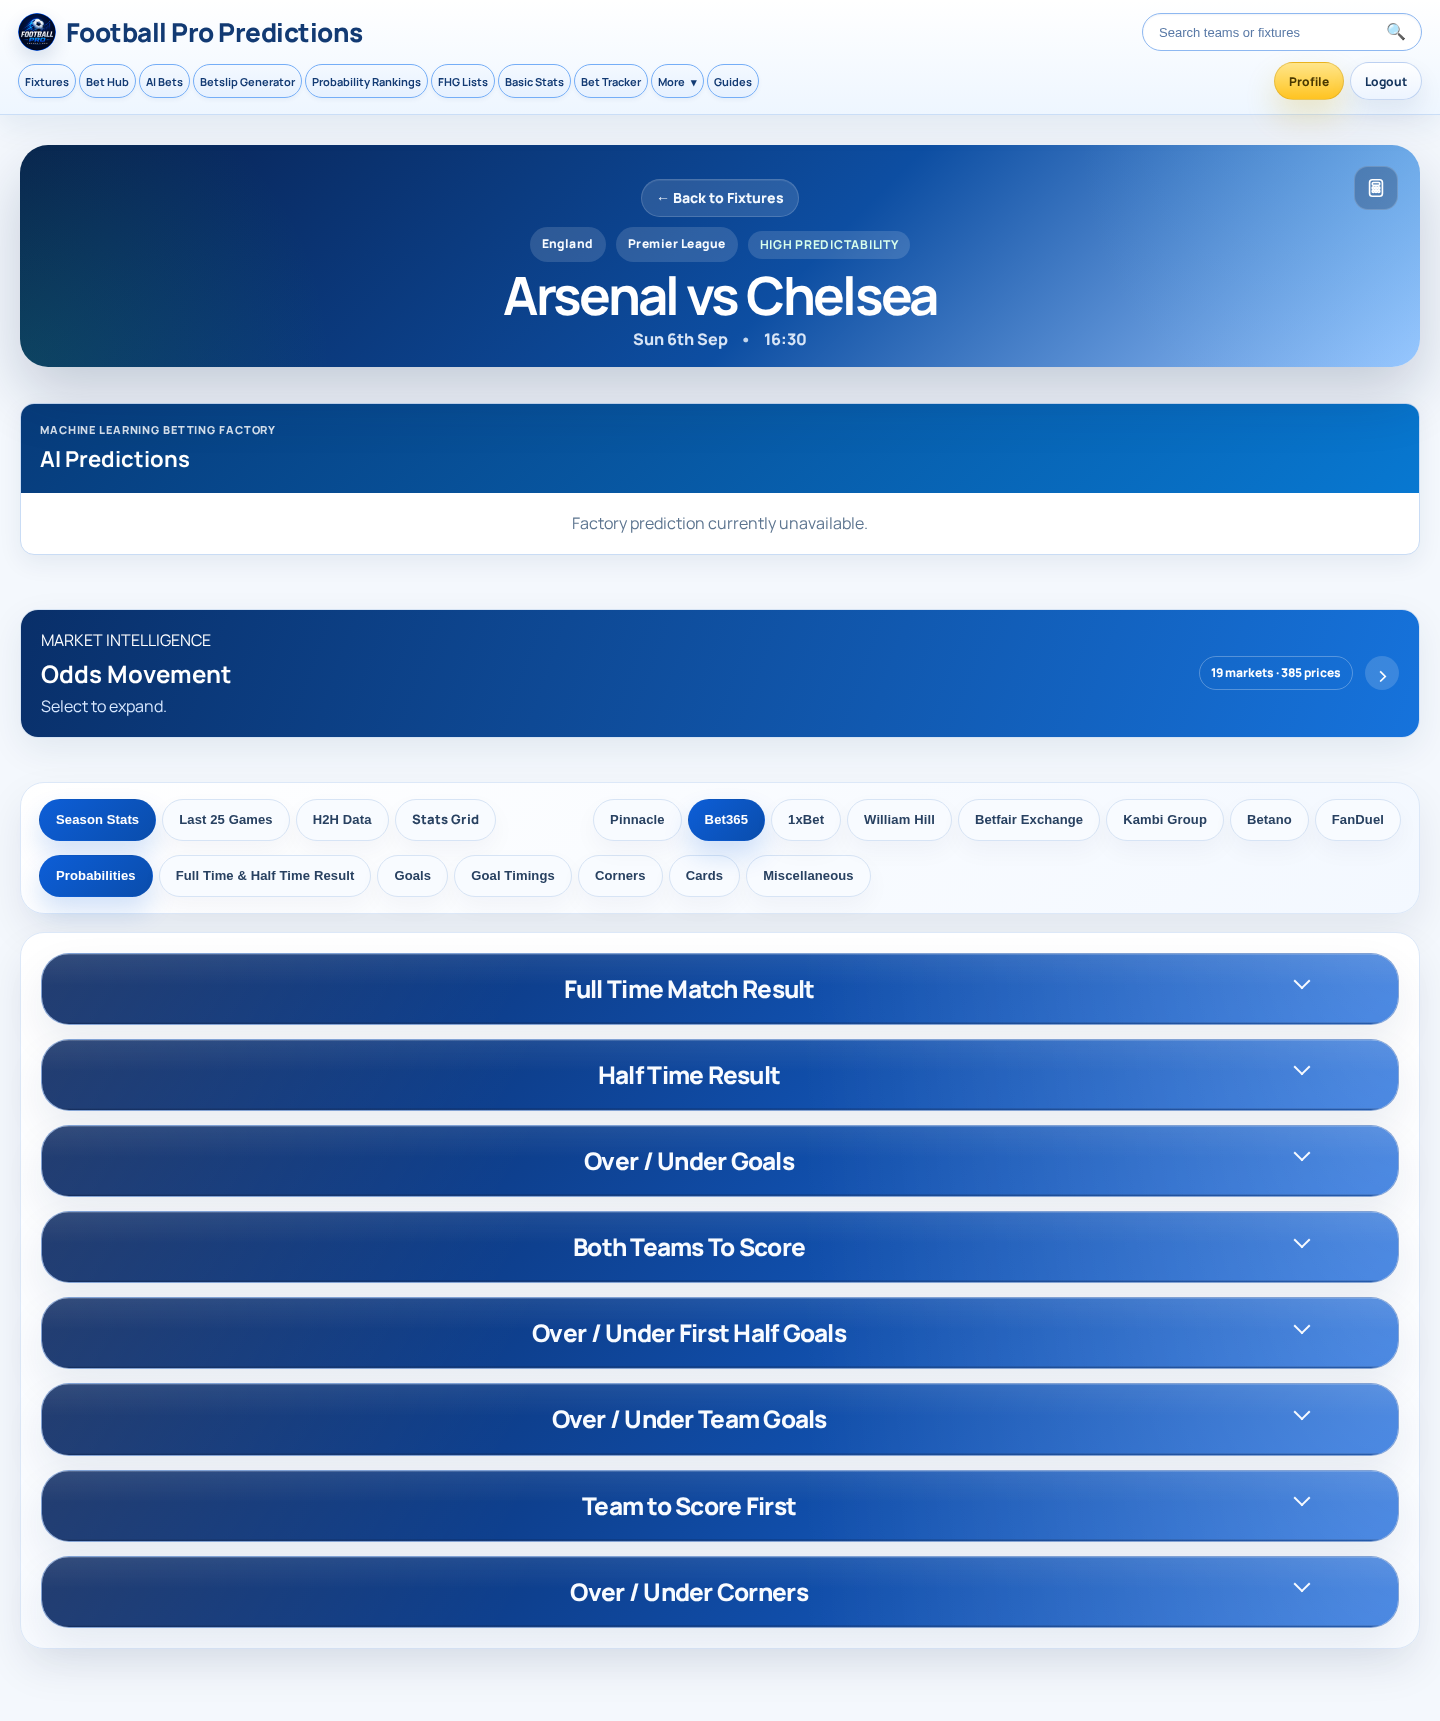
Arsenal over 0.5 goals has sound attacking and defensive pairing. Arsenal score 1.62 per home game, while Chelsea concede 0.83 away, producing 1.23. Arsenal scored in 84.62% of home matches and Chelsea conceded in 90.00% away. Arsenal over 0.5 goals is preferable to a multi-goal team line.
Arsenal’s defensive record supports Chelsea under 1.5 goals as a research opportunity. Arsenal allow only 0.62 goals at home, while Chelsea score 1.42 away, giving a 1.02 midpoint. Arsenal conceded more than one in only 23.08% of home matches; Chelsea scored more than one in 25.00% away. This is a team-total under, not a prediction of a clean sheet.
Corners merit a modest match line. Arsenal home fixtures average 9.85 corners and Chelsea away games 8.75, a 9.30 blend. The over-5.5 rates are 100.00% and 91.67%. Over 5.5 match corners sits well below the paired average and is safer than extrapolating Arsenal’s eight-corner season display.
Arsenal take 6.15 home corners, while Chelsea concede 5.20 away, for 5.68. Arsenal exceeded four corners in 69.23% of home games, though Chelsea allowed five or more in only 50.00% away. Arsenal over 3.5 corners is the cautious team line, retaining a margin for Chelsea’s away defensive results.
Cards are supported without presuming derby intensity. Arsenal home matches average 2.69 cards and Chelsea away games 4.00, a 3.35 blend. Both cleared 1.5 cards in at least 75.00% of their venue samples. Over 1.5 match cards is supported, while higher thresholds are more variable.
Arsenal average 15.15 home shots and Chelsea allow 12.70 away, producing 13.93. Arsenal recorded the most shots in 76.92% of their home sample. Arsenal over 10.5 shots is a team-volume research opportunity with room beneath the blend. The season total of 20 supports activity, but is not the principal evidence.
Recommendations
Key takeaways
- Over 1.5 match goals
- Arsenal over 0.5 goals
- Chelsea under 1.5 goals
- Over 5.5 match corners
- Arsenal over 3.5 corners
- Over 1.5 match cards
- Arsenal over 10.5 shots
Conservative example builder: Arsenal over 0.5 goals, Chelsea under 1.5 goals and over 5.5 corners. Higher-variance example builder: over 1.5 match goals, Arsenal over 3.5 corners and Arsenal over 10.5 shots, linking Arsenal’s home attacking-volume indicators.
Sources and further reading
- Ipswich Town vs Liverpool — Football Pro Predictions
- Newcastle United vs AFC Bournemouth — Football Pro Predictions
- Nottingham Forest vs Tottenham Hotspur — Football Pro Predictions
- Manchester City vs Coventry City — Football Pro Predictions
- Fulham vs Crystal Palace — Football Pro Predictions
- Brighton & Hove Albion vs Leeds United — Football Pro Predictions
- Brentford vs Sunderland — Football Pro Predictions
- Hull City vs Aston Villa — Football Pro Predictions
- Everton vs Manchester United — Football Pro Predictions
- Arsenal vs Chelsea — Football Pro Predictions