
How to Use the Probability Rankings and Basic Stats Pages
A beginner’s guide to reading, filtering, and comparing football data on the Probability Rankings and Basic Stats pages—without confusing model probability, odds, value, and displayed trend percentages.
Introduction: Two Pages, Two Different Questions
The Probability Rankings and Basic Stats pages are designed for different kinds of football research. Probability Rankings is a ranked fixture-market board: it helps you compare model probability alongside implied odds, actual odds, displayed value, league predictability and tracking controls. Basic Stats is a trend dashboard: it presents upcoming fixtures with percentage columns for selected goal, corner and card views.
This guide explains how to navigate and interpret the information shown on each page. It does not treat a ranking, percentage, price or filter result as proof that an event will happen. The two pages can support comparison and record-keeping, but context and the underlying methodology still matter.
At a Glance: When to Use Probability Rankings vs Basic Stats
| Page | Main purpose | What you compare | Useful controls | Key caution |
|---|---|---|---|---|
| Probability Rankings | Rank fixture-market selections | Model probability, implied odds, actual odds, displayed value and predictability | Date, league presets, predictability, market, bookmaker, search and ranges | A high probability or positive displayed value is not a guarantee. |
| Basic Stats | Review displayed fixture trends | Percentage columns for the selected goal, corner or card summary | View mode, date, league presets, predictability and custom conditions | Percentages are trend indicators; their sample basis and calculation period should be checked in methodology. |
Part 1 — Understanding the Probability Rankings Page
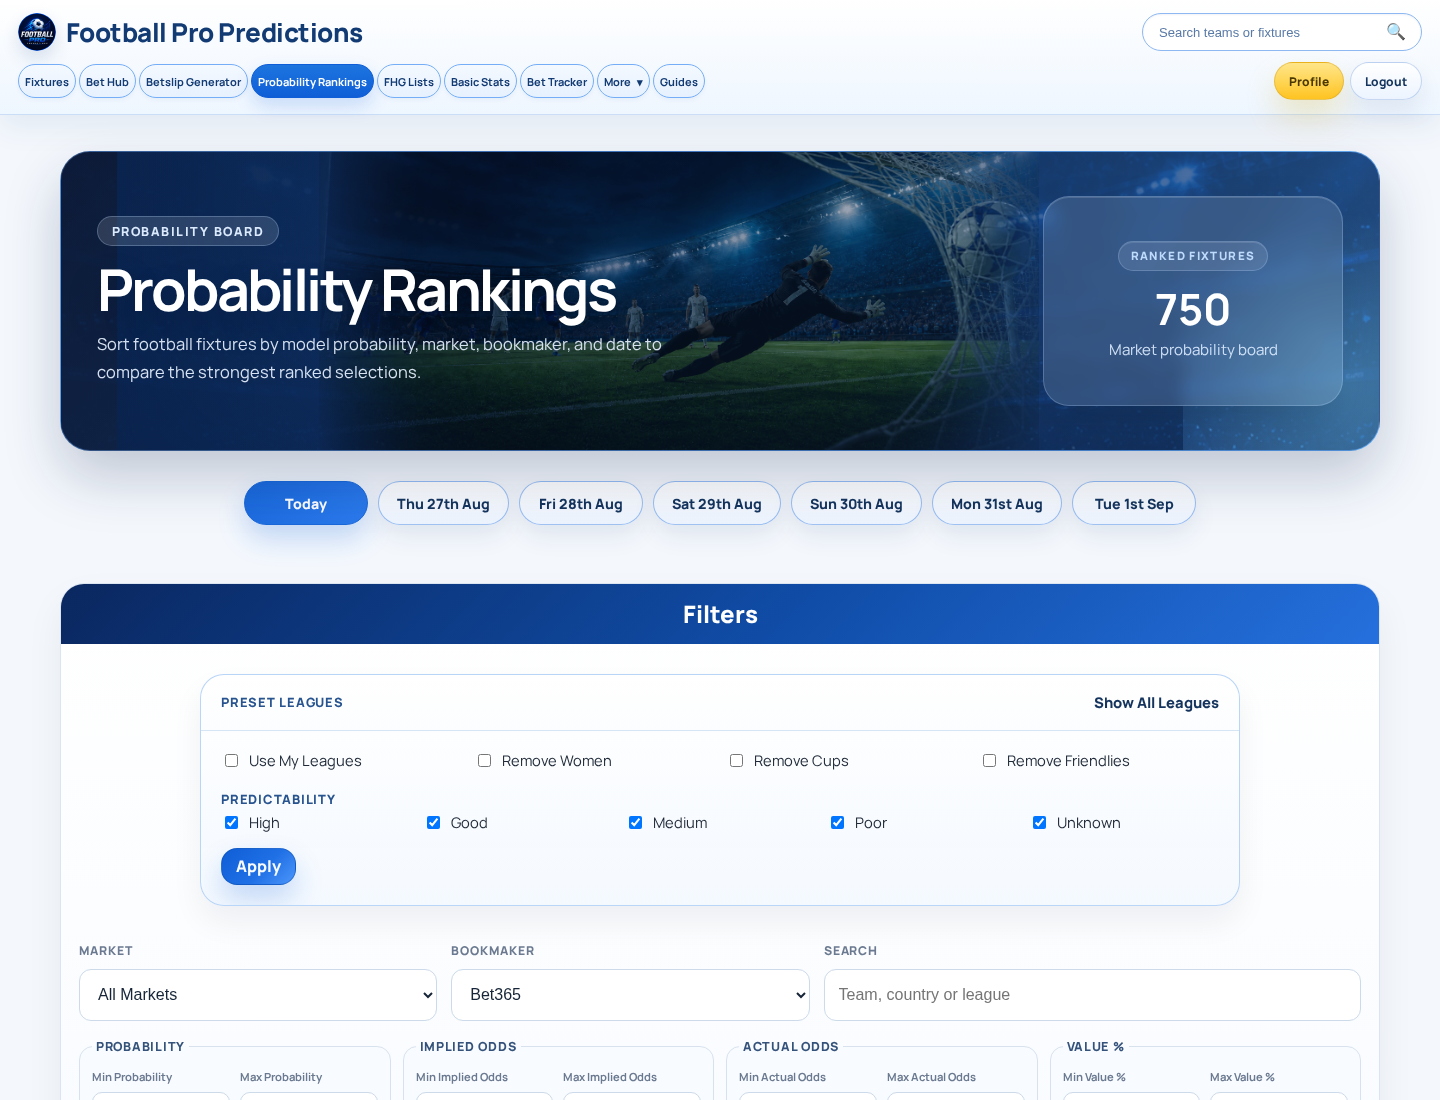
The Probability Board presents dated ranked fixtures and their available markets. Its visible controls include preset league options, predictability labels, a market selector, a bookmaker selector, search, probability and odds ranges, value ranges, an Odds Available option and a Value Only option. Use these controls to narrow a large list before comparing rows.
Step 1: Choose the Date, League Scope and Predictability
Start with the date tabs, then set the league scope. The preset league controls shown are Show All Leagues, Use My Leagues, Remove Women, Remove Cups and Remove Friendlies. These are practical ways to make the fixture list more relevant to the competitions you want to review.
You can also select High, Good, Medium, Poor or Unknown under League Predictability and apply that selection. Treat these labels as a way to narrow the board, not as a standalone assessment of a fixture. The page interface does not explain the calculation rules for these bands, so their methodology should be consulted when it is published or available.
Step 2: Pick a Market Before Comparing Fixtures
The market menu covers several groups: match result and half-time result, double chance, both teams to score, goal totals, home and away team goal totals, corner totals, first team to score, and first-half goal markets. Select one market first, then compare like with like. A Home Win row and an Over 2.5 Goals row describe different events, so their probabilities and odds should not be treated as directly interchangeable.
| Market group | Examples shown on the page | Comparison reminder |
|---|---|---|
| Result markets | Home Win, Draw, Away Win; half-time equivalents | Compare the same result market across fixtures. |
| Goals markets | BTTS, Over/Under totals, team totals, first-half goals | Keep the threshold and match period consistent. |
| Corners markets | Over/Under corner totals | Compare the same total and direction. |
| First to score | Home Scores First, No Goals First, Away Scores First | These are distinct from match-result markets. |
Step 3: Read One Ranking Row from Left to Right
Each row visibly includes kickoff time, fixture, league, market, league predictability, probability, implied odds, actual odds, value and a Track column with an Add to Bet Tracker control. The table headings display sort controls, allowing you to order the visible list by the available columns. A useful reading order is: confirm the fixture and market first; then review predictability, probability and the two odds fields; finally, consider the displayed value in context.
Probability, Implied Odds, Actual Odds and Value: The Important Distinctions
| Term | How to read it | What it does not mean |
|---|---|---|
| Probability | The page describes rankings as sorted by model probability. It is expressed as a percentage. | Certainty that the event will occur. |
| Implied odds | An odds-form representation of a probability. | The displayed bookmaker price. |
| Actual odds | The price displayed for the selected bookmaker. | A model probability or a forecast. |
| Value | A displayed comparison metric on the rankings page. | Guaranteed profit or an outcome guarantee. |
Illustrative maths only: under the standard decimal-odds relationship, implied odds equal 1 divided by probability expressed as a decimal. A 50% probability is 0.50, so 1 ÷ 0.50 = 2.00 decimal implied odds. This example explains a common relationship; it should not be read as confirmation of the platform’s exact implied-odds formula, rounding convention or value calculation.
Step 4: Use the Advanced Ranking Filters Deliberately
A straightforward workflow is to select a date, choose one market, restrict leagues if needed, select a bookmaker, and then set probability, implied-odds, actual-odds or value ranges. Use the search field when you need to locate a team, league or other matching text. Select Apply Filters after setting the advanced controls.
Odds Available can help limit the view to entries with displayed odds. Value Only limits the list according to the platform’s own value criterion. Neither control changes the uncertainty of a fixture, and neither should be interpreted as a recommendation.
What “Add to Bet Tracker” Does—and Does Not—Mean
Part 2 — Understanding the Basic Stats Page
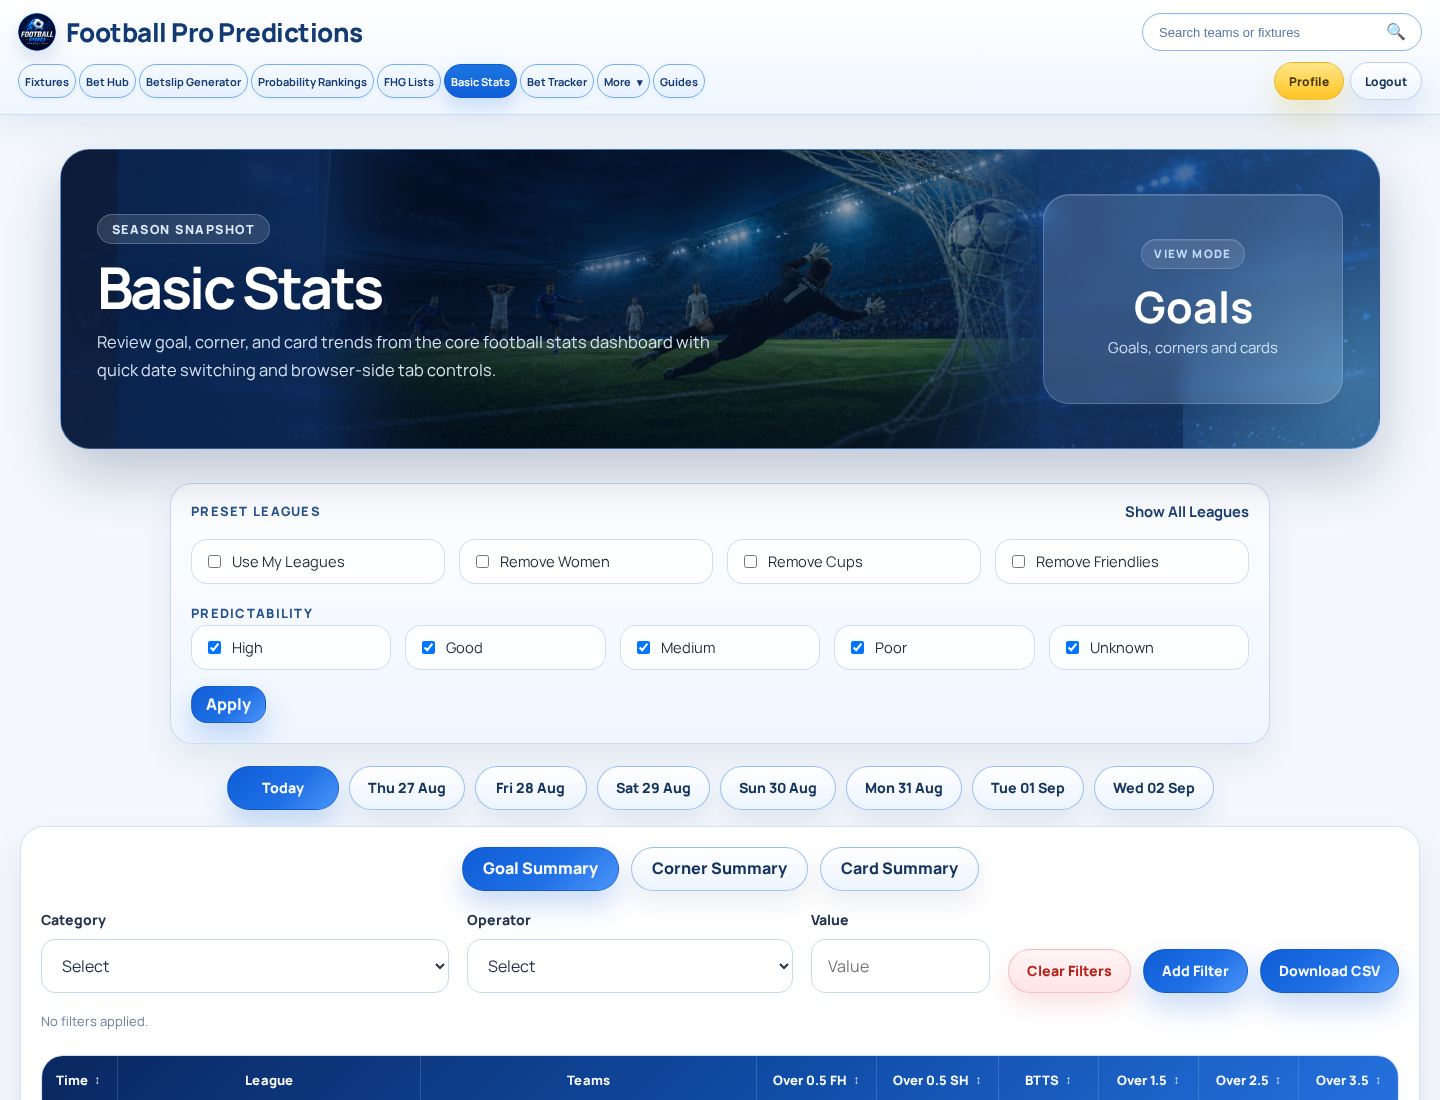
Basic Stats is labelled a Season Snapshot and describes itself as a core football stats dashboard with quick date switching and browser-side tab controls. It offers Goals and Goals, corners and cards view modes, preset league filters, predictability filters, summary controls, a custom filter builder, sortable headings, pagination and Download CSV.
Step 1: Select a View and a Date
Choose Goals for the goal-focused table, or select Goals, corners and cards to access the expanded dashboard view. Then use the date tabs to set the fixture slate. The interface also provides Goal Summary, Corner Summary and Card Summary controls. The supplied research confirms these controls are shown, but does not confirm every metric that appears in each summary or whether categories vary by competition.
Step 2: Read the Goals Table Without Overstating It
| Column | Event label in plain language |
|---|---|
| Over 0.5 FH | At least one goal in the first half. |
| Over 0.5 SH | At least one goal in the second half. |
| BTTS | Both teams score. |
| Over 1.5 | At least two goals in the match. |
| Over 2.5 | At least three goals in the match. |
| Over 3.5 | At least four goals in the match. |
The percentages shown in these columns are dashboard trend rates. They are not, on the supplied evidence, confirmed forecasts or a stated probability model. Before drawing a strong conclusion, check the site methodology for the lookback period, sample rules, home/away treatment, minimum sample size, refresh schedule and handling of postponed, abandoned or unplayed matches. A displayed 0% or 100% can be especially misleading if its underlying sample is limited or unknown.
Step 3: Build a Custom Basic Stats Filter
The filter builder lets you choose a Category, select an Operator, enter a Value and choose Add Filter. The visible operators are Greater, Less, Equals, Greater or Equals, and Less or Equals. Clear Filters resets the selection. For example, you might filter rows where the displayed BTTS percentage is greater than a threshold you choose for a particular review. That is a sorting method, not a claim that any threshold is inherently good.
Sort, Export and Check the Context
A Beginner Workflow: Use Both Pages in the Right Order
Keep the comparison consistent. If Basic Stats prompts you to examine a goal-related trend, open the equivalent goal market in Probability Rankings rather than switching to an unrelated result or corner market. The pages provide different signals: one is ranking-led and one is trend-led. Neither removes uncertainty.
Common Interpretation Errors to Avoid
Frequently Asked Questions
Key Takeaways
Key takeaways
- Probability Rankings compares fixture-market entries using model probability, odds fields, displayed value and predictability.
- Basic Stats surfaces displayed goal, corner and card trends for upcoming fixtures.
- Date, league, market, bookmaker and condition filters make large fixture lists more manageable.
- Probability, implied odds, actual odds and value describe different things and should not be conflated.
- Methodology, sample context and uncertainty matter on both pages; neither page guarantees an outcome.
Sources, Methodology and Further Reading
Interface references: Probability Rankings (/probability-rankings) and Basic Stats (/basic-stats). Before publication, add only verified first-party links to the platform’s methodology, market glossary, responsible-gambling information, Bet Tracker guidance and My Leagues guidance where those pages exist.
Sources and further reading
- Probability Rankings — Football Pro Predictions
- Basic Stats — Football Pro Predictions
Put This Guide Into Practice
Use the live research tools to compare upcoming fixtures, probabilities and available prices. Always check current odds and stake responsibly.