
Football Betting Tips Today - Sarmiento vs River Plate - Argentina · Liga Profesional de Fútbol
A statistics-led preview of Sarmiento vs River Plate, separating the relevant Last 25 Games home-and-away splits from the season sample and assessing a four-leg Bet Builder without odds or certainty claims.
Sarmiento vs River Plate betting tips: statistical snapshot
This Sarmiento vs River Plate analysis gives priority to the relevant Last 25 Games splits: Sarmiento’s 13 home matches and River Plate’s seven away matches. That is a more useful comparison than combining every match each side has played, because venue can materially alter results, possession and shot volume. Football Pro Predictions presents those Home, Away and Overall columns side by side; the relevant Home and Away columns are the focus here.
The four markets assessed are Over 0.5 Second-Half Goals, Over 5 Total Corners, Over 2 Total Cards and River Plate to Record Most Shots. They cover four different match measures, but they are not a prediction of the result and do not guarantee a return. Check that each market, its settlement rules and its availability match your bookmaker’s listing before considering any bet.
The relevant records: home form versus away form
The relevant Last 25 Games results make for a close comparison. Sarmiento collected 23 points from 13 home matches, while River Plate collected 13 from seven away matches. The points-per-game figures are 1.77 and 1.86 respectively. Neither number should be mistaken for an expected outcome in this fixture, but both show why the away side’s record deserves attention despite the smaller sample.
| Measure | Sarmiento at home | River Plate away |
|---|---|---|
| Matches played | 13 | 7 |
| Wins, draws, losses | 7, 2, 4 | 4, 1, 2 |
| Points per game | 1.77 | 1.86 |
| Total goals per match | 2.15 | 2.00 |
| Second-half goals per match | 1.15 | 1.57 |
| Total corners per match | 9.15 | 7.57 |
| Total yellow cards per match | 5.85 | 5.14 |
| Shots for per match | 10.15 | 12.57 |
| Possession for | 43.00% | 65.71% |
The possession and shot figures identify a meaningful stylistic difference in these relevant splits. Sarmiento averaged 43.00% possession and 10.15 shots at home; River Plate averaged 65.71% possession and 12.57 shots away. Those are historical match averages, not a guarantee that the next match will follow the same pattern.

| Measure | Sarmiento at home | River Plate away |
|---|---|---|
| Matches played | 13 | 12 |
| Wins | 8 | 6 |
| Draws | 2 | 2 |
| Losses | 3 | 4 |
| Points per game | 2.00 | 1.67 |
| Total goals per match | 2.23 | 1.83 |
| Second-half goals per match | 1.00 | 1.00 |
| Possession for | 43.62% | 63.75% |
The season sample broadly retains the home-versus-away contrast in possession, but it tempers the results reading. Sarmiento’s home points-per-game figure rises to 2.00 across the season, while River Plate’s away figure falls to 1.67. The two sample sets are related but not interchangeable, so the season numbers are context rather than a replacement for the Last 25 Games comparison.
Goals profile: a second-half goal is the measured angle
Over 0.5 Second-Half Goals is the selected goals angle because it has support in both relevant splits. It landed in 9 of Sarmiento’s 13 home matches (69.23%) and 6 of River Plate’s 7 away matches (85.71%). The corresponding average second-half goal totals were 1.15 and 1.57. This is evidence of prior second-half scoring activity, rather than proof that a goal will arrive after the interval.
The first-half numbers are less aligned. Over 0.5 First-Half Goals occurred in 76.92% of Sarmiento home matches but only 28.57% of River Plate away matches in the relevant sample. That difference is a reason not to add a first-half goal condition simply because one team’s record is high. The builder uses one goals-market selection only: Over 0.5 Second-Half Goals.
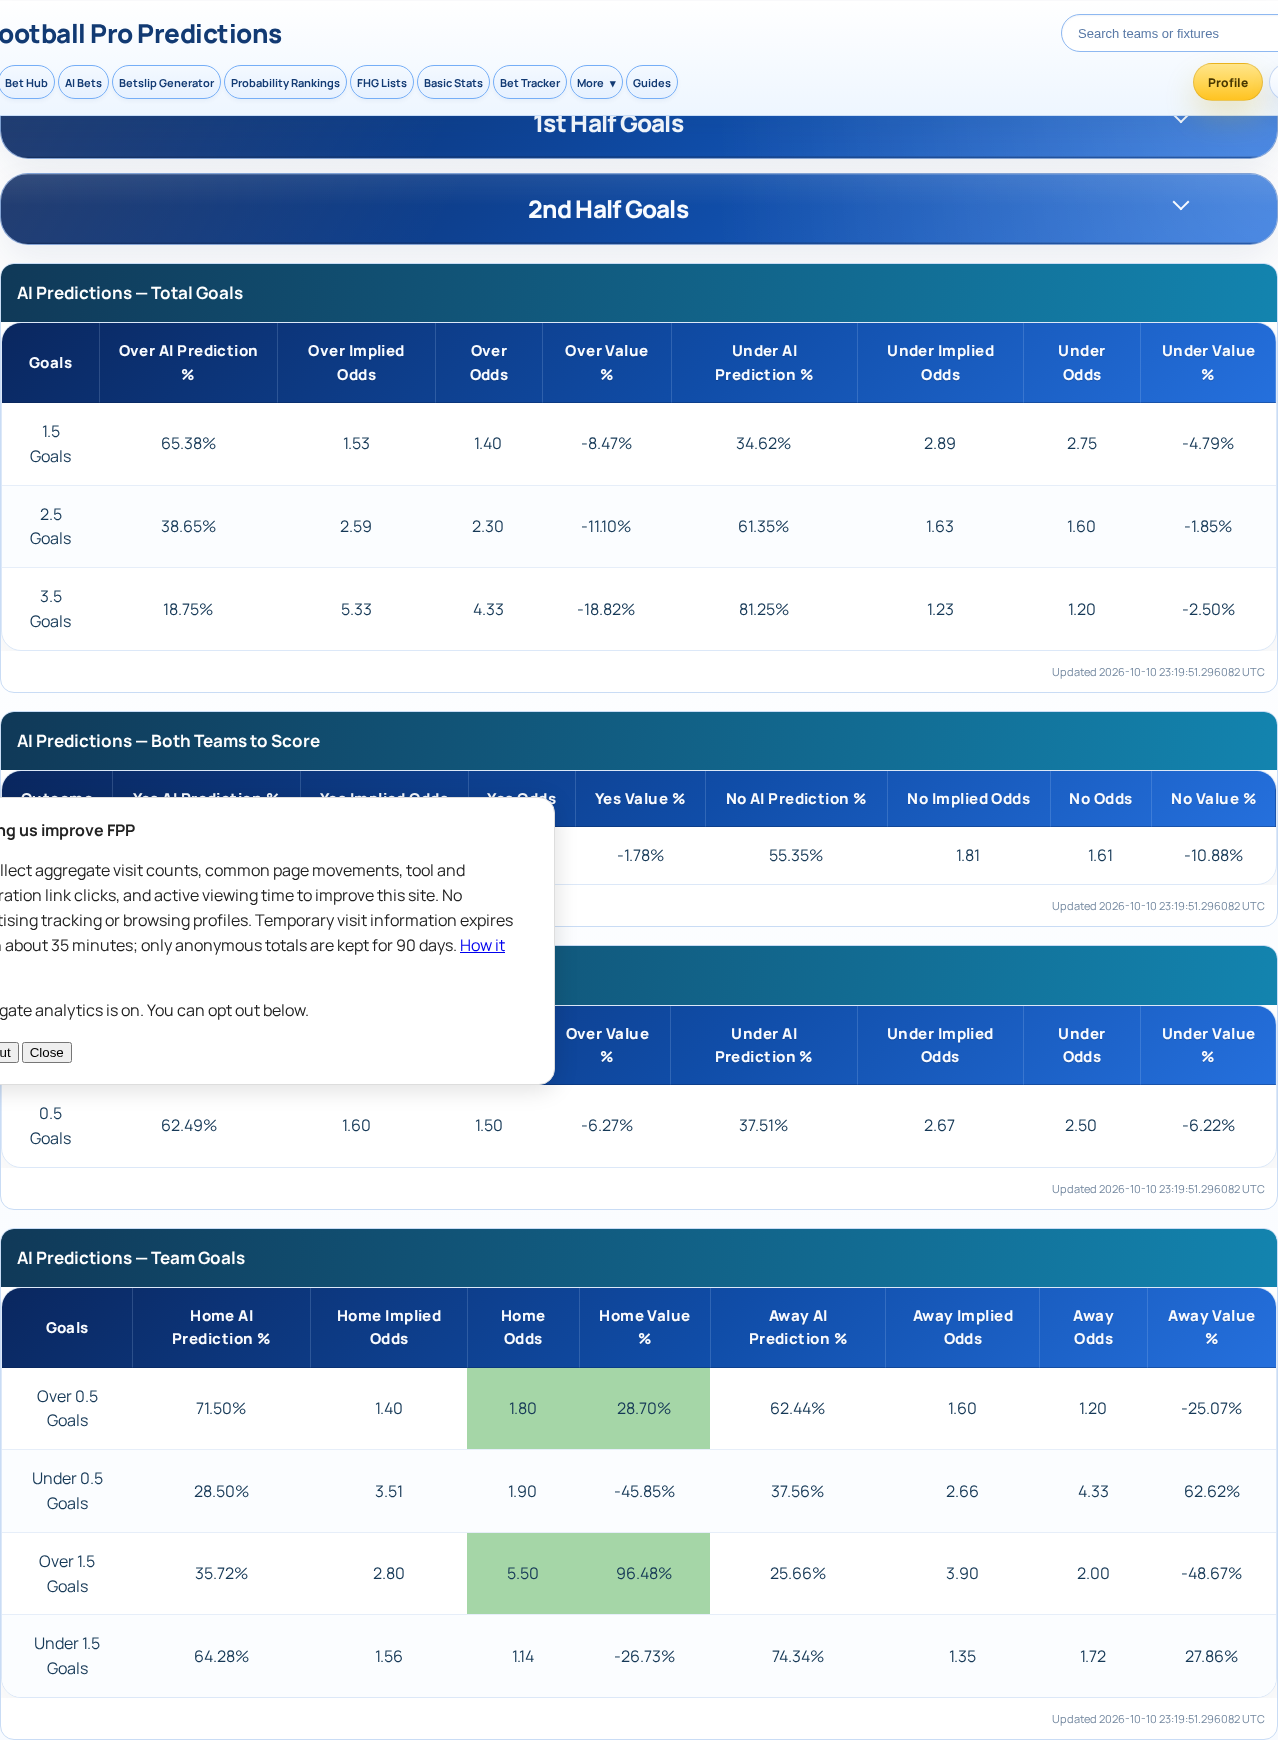
Season context is more moderate: Over 0.5 Second-Half Goals occurred in 61.54% of Sarmiento’s 13 home season matches and 66.67% of River Plate’s 12 away season matches. The direction still supports a low second-half threshold, but the change reinforces the need to avoid treating percentages as certainty.
Reading the match statistics page
The underlying fixture data can be viewed on the Sarmiento vs River Plate statistics page. For this matchup, read Sarmiento’s Home column against River Plate’s Away column. The Overall columns aggregate home and away matches, so they answer a different question and are not substituted for the venue-specific figures in this guide.
Football Pro Predictions groups the relevant measures into results, goals, corners, cards, shots and possession. A sensible way to use the page is to first check the sample size labelled Played, then compare like-for-like Home and Away values, and finally keep season statistics separate from the Last 25 Games section. This prevents a strong overall figure from obscuring a weaker venue-specific record.
Corners and cards: two separate sources of match activity
Over 5 Total Corners is a low threshold supported by both relevant records. It occurred in 11 of 13 Sarmiento home matches (84.62%) and 6 of 7 River Plate away matches (85.71%). Their average total-corner figures were 9.15 and 7.57. These figures do not establish how corners will be divided between the teams; they only describe overall corner totals in the selected historical splits.
The season sample points in the same direction for this threshold: Over 5 Total Corners occurred in all 13 Sarmiento home season matches and in 10 of River Plate’s 12 away season matches (83.33%). Even so, corners can swing sharply with match state. An early lead may change the need for pressure, territory and attacks into the penalty area.
Over 2 Total Cards also has support in the Last 25 Games splits, occurring in 12 of 13 Sarmiento home matches (92.31%) and 6 of 7 River Plate away matches (85.71%). The total yellow-card averages were 5.85 and 5.14. Season context is similarly high at 92.31% for Sarmiento at home and 91.67% for River Plate away. However, card settlement can differ by bookmaker, including whether cards to staff or certain disciplinary events count, so readers should check the specific rules.
Cards and corners are separate market families, but neither is insulated from match events. Refereeing decisions, a red card, a late chase for an equaliser or a comfortable lead can all change their course. The evidence supports consideration of modest thresholds, not an assumption that the conditions will repeat.
Why River Plate lead the shots comparison
The shots leg is based on a comparative tendency rather than a team-total line. River Plate recorded the most shots in 5 of 7 relevant away matches (71.43%). Sarmiento recorded the most shots in only 2 of 13 relevant home matches (15.38%). River Plate’s 12.57 away shots-for average also exceeds Sarmiento’s 10.15 at home, while their away possession figure is considerably higher.
The separate season sample is less emphatic but points the same way: River Plate recorded most shots in 7 of 12 away matches (58.33%), compared with Sarmiento in 4 of 13 home matches (30.77%). That consistency gives River Plate to Record Most Shots a clearer statistical basis than a higher River Plate shot-total requirement. It remains a historical tendency, not a forecast guarantee.
Sarmiento vs River Plate Bet Builder: four legs, checked together
| Market | Relevant Last 25 Games evidence | Why it is considered | Key limitation |
|---|---|---|---|
| Over 0.5 Second-Half Goals | Sarmiento home: 69.23% (9/13); River Plate away: 85.71% (6/7). Second-half goal averages: 1.15 and 1.57. | A modest second-half goal threshold is supported in both venue-specific splits. | River Plate’s away sample is seven matches; scoreline and game state affect second-half urgency. |
| Over 5 Total Corners | Sarmiento home: 84.62% (11/13); River Plate away: 85.71% (6/7). Total-corner averages: 9.15 and 7.57. | Both records clear this low total-corner line regularly. | A lead, red card or tactical shift can suppress corner volume. |
| Over 2 Total Cards | Sarmiento home: 92.31% (12/13); River Plate away: 85.71% (6/7). Total yellow-card averages: 5.85 and 5.14. | Both historical splits exceed the threshold frequently. | Refereeing and bookmaker card-counting rules matter. |
| River Plate to Record Most Shots | River Plate recorded most shots in 71.43% of away matches (5/7); Sarmiento did so in 15.38% of home matches (2/13). Shots-for averages: 12.57 and 10.15. | River Plate’s comparative shots record and away possession profile are stronger. | A small away sample and individual match tactics can reverse the pattern. |
The builder contains one goals selection, one corners selection, one cards selection and one shots selection. It therefore does not stack multiple conditions from the same underlying market family. That does not make the selections independent: an early goal, a dismissal or a sustained period of pressure can influence goals, corners, cards and shots at the same time. Assess the legs together and do not calculate certainty from the individual historical rates.
Markets not strengthened by the relevant splits
There is no need to add BTTS, a total-goals line or a team-goals line to this builder. They would create extra restrictions tied to the same underlying scoring pattern as Over 0.5 Second-Half Goals. In the relevant Last 25 Games data, BTTS occurred in 38.46% of Sarmiento home matches and 42.86% of River Plate away matches, both below 60%. Those figures do not make a contrary bet automatically correct; they simply do not strengthen a BTTS addition.
Higher corner and card thresholds are also unnecessary for this assessment. Although the records show substantial activity, every extra condition narrows the route to settlement. The proposed lines stay at low thresholds and retain one selection from each market family rather than turning several related statistics into a single, more fragile slip.
Key takeaways and responsible betting
Key takeaways
- River Plate’s relevant away shots profile is stronger: 5 of 7 away matches with most shots, compared with Sarmiento’s 2 of 13 at home.
- A low second-half goal threshold has support in both Last 25 Games venue splits, but River Plate’s seven-match away sample limits confidence.
- Over 5 Total Corners and Over 2 Total Cards both clear their thresholds frequently in the relevant historical records.
- Historical records are not guarantees. Check availability and market rules, set a fixed budget and do not chase losses.
Football Pro Predictions can help readers compare the relevant historical columns, but a statistical profile is only one part of a betting decision. Recheck the fixture page and your bookmaker’s rules close to the time of any wager, and only risk an amount you can afford to lose.
Frequently asked questions
Why use Sarmiento’s home figures and River Plate’s away figures instead of overall records?
They match the setting of this fixture. Overall records blend home and away matches, which can conceal important differences in results, possession, shots and other measures. The relevant Last 25 Games comparison is Sarmiento at home against River Plate away.
Are season statistics and Last 25 Games statistics interchangeable?
No. They are separate samples with different match counts and, in some cases, different conclusions. This guide uses the Last 25 Games home-and-away splits as its primary evidence and labels season figures as context.
Why does the Bet Builder contain only one goals leg?
Adding BTTS, team goals or another total-goals selection would create additional restrictions connected to the same scoring pattern. The analysis uses Over 0.5 Second-Half Goals as the sole goals selection and does not stack connected goal markets.
Where can I view the underlying fixture statistics?
The relevant Home, Away and Overall figures are available on the Sarmiento vs River Plate fixture statistics page.
Sources and further reading
- Football Pro Predictions — Football Pro Predictions
Put This Guide Into Practice
Use the live research tools to compare upcoming fixtures, probabilities and available prices. Always check current odds and stake responsibly.